
Human eyes are not passive observers. They scan, filter, and interpret the world before the mind even knows it. Think of a bustling marketplace. Even before you consciously look for anything specific, your gaze is drawn to a red umbrella, a vendor’s bright sign, or a stack of unusually large fruits. That instant pull of attention happens before thought. This is the essence of pre-attentive attributes. They are visual cues that stand out immediately, guiding attention without conscious effort. In the digital age, where information overwhelms users every moment, knowing how to apply these cues transforms communication from noise into clarity.
To understand this concept, imagine data not as numbers or charts but as a symphony. If every instrument plays at the same volume, the music becomes chaotic. But with the right tempo, pitch, and emphasis, the melody emerges. Pre-attentive attributes serve as those moments of emphasis. They highlight what matters most.
Color: The Silent Director of Visual Attention
Color can speak without saying a word. In a sea of grey text, a single element in bright teal or red becomes the visual anchor. Designers, dashboard creators, and advertisers often use intentional color contrast to guide a viewer’s eyes to the most important point. However, color is not only about vibrancy. It is also about emotional tone. A calming blue can suggest trust. A cautionary yellow can alert users to something requiring attention. When done right, color directs attention where it is needed, reducing the cognitive load on the viewer.
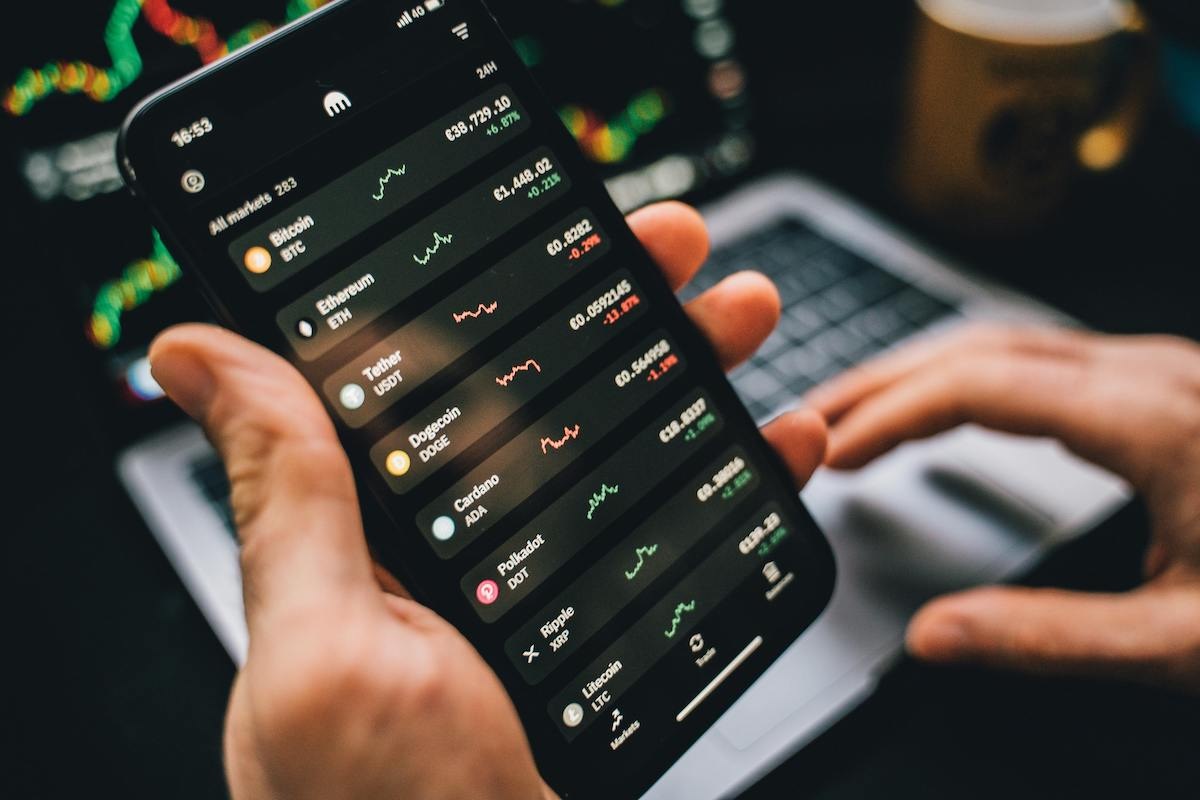
A learner exploring a data analytics course might encounter dashboards filled with charts. Without color hierarchy, these charts appear overwhelming. But when a designer highlights only the key trend line in a contrasting color, the insight emerges immediately. Color becomes the hand that points without interrupting the experience.
Size and Scale: Making the Important Feel Important
Size is one of the oldest and most intuitive ways to signal significance. Ancient manuscripts used enlarged letters to show the beginning of a key section. Today, presentations and digital interfaces still rely on size to create balance and focus. The largest element in a visual space is often interpreted as the most important, even before we consciously process what it is.
For instance, city planners often create larger signage for emergency services to ensure they are recognized instantly. Similarly, mobile app designers enlarge central action buttons to encourage specific user behavior. Size directs attention, sets hierarchy, and prevents confusion. Students pursuing a data analyst course in pune often learn this principle hands-on when designing data-driven dashboards. When numerical values are shown in proportional sizes, trends become intuitive, not just visible.
Shape and Form: Guiding Perception Through Distinction
Shapes carry associative meaning. A circle feels harmonious and continuous, while a triangle can appear directional and dynamic. In user interfaces and visual analytics, unique shapes help differentiate categories or signify interaction points. This becomes even more powerful when combined with color and size.
Consider public transport maps. Stations may be circles, transfer points squares, and terminals diamonds. Commuters identify their route faster because the shapes themselves convey context. In data storytelling, varying shapes allows an audience to understand multiple data dimensions without additional text. Shape turns complexity into recognition.
Position and Arrangement: The Art of Guiding the Eyes
Where something is placed determines how it will be seen. The upper-left corner of a screen is often the first point of attention for cultures that read left to right. Designers strategically place headlines, logos, and key information where the human eye naturally travels first. This principle extends into data visualization and layout design. Proper spacing and grouping allow users to see patterns without strain.
Imagine a restaurant menu. Items are often grouped logically so that the customer unconsciously navigates categories. Placing a chef’s recommendation at the top right corner subtly increases its chances of being selected. Position is less about creativity and more about empathy for how people perceive information.
Movement: The Most Immediate Attention Hook
Among all cues, movement captures attention the fastest. A flicker in the corner of the eye once meant the difference between survival and danger. Today, animations, blinking indicators, and dynamic charts tap into that instinct. However, movement must be used sparingly. Too much of it leads to distraction rather than guidance.
Digital fitness apps, for example, may animate a progress ring to celebrate achievement. The motion draws the eye and creates emotional engagement, turning data into motivation. Movement, when subtle and purposeful, becomes an emotional anchor as well as a visual one.
Conclusion
Pre-attentive attributes work because they align with how human perception has evolved. They reduce the effort required to interpret information, turning complexity into clarity. Whether one is building dashboards, designing learning platforms, or crafting digital products, attention is the most valuable currency. Mastering how to direct it is a decisive skill.
Learners taking a data analytics course will soon realize that insights are not only about analysis but also about communication. Similarly, students enrolled in a data analyst course in pune discover that data storytelling is as much about visual emphasis as it is about logic. Pre-attentive attributes bridge the gap between seeing and understanding. They don’t just display information. They make meaning visible.
Business Name: ExcelR – Data Science, Data Analyst Course Training
Address: 1st Floor, East Court Phoenix Market City, F-02, Clover Park, Viman Nagar, Pune, Maharashtra 411014
Phone Number: 096997 53213
Email Id: enquiry@excelr.com

